During times of momentous change, stories are presented, analyzed and better told using tech and tools from Media Cluster Company Vizrt. Four billion people worldwide will be watching as one of the most spectacular election nights in US history unfolds.
– It's a feeling of being extremely proud, but also extremely humble on the role we actually play that evening, says Petter Ole Jakobsen, Founder and Chief Innovation Officer of Vizrt. An estimated four billion people will be watching the US Presidential election. That’s half the world’s population watching this single event! And almost all watching through the hundreds and thousands of broadcasters and media outlets around the world using Vizrt tools and technology.
From TV 2 to CNN
The international election breakthrough for Vizrt dates back to the 1998 U.S. mid-term election with CBS as the first major U.S. network to adopt Vizrt software on election day. Then came ABC News, Fox News, CBS News, and many others. Another memorable moment was when CNN experimented with remote "holographic" live interviews during the coverage of the 2008 U.S. Presidential election using Vizrt technology. Prior to these pivotal moments, Vizrt had already conquered the Norwegian and Scandinavian market, with Norwegian TV 2 as their breeding ground and sandbox for innovation and development.

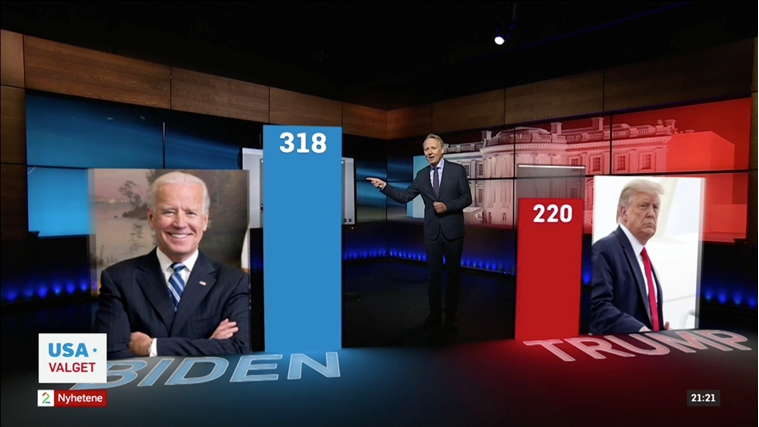
TV 2 Norway ready to go with brand new visuals and AR using Vizrt technology.
Vizrt magic
As always, Petter Ole Jakobsen is eager to watch how the broadcasters all over the world will cover the election night.
– It's always very exciting to watch both the presenters and the visualization of the incoming data. The studio presenters can explain something immensely complex, in a very short time, in a very effective way using our tools. It's fascinating to watch and compare how the different broadcaster utilizes our tools to explain and analyze the election data, adding augmented reality and virtual set designs, Jakobsen said.
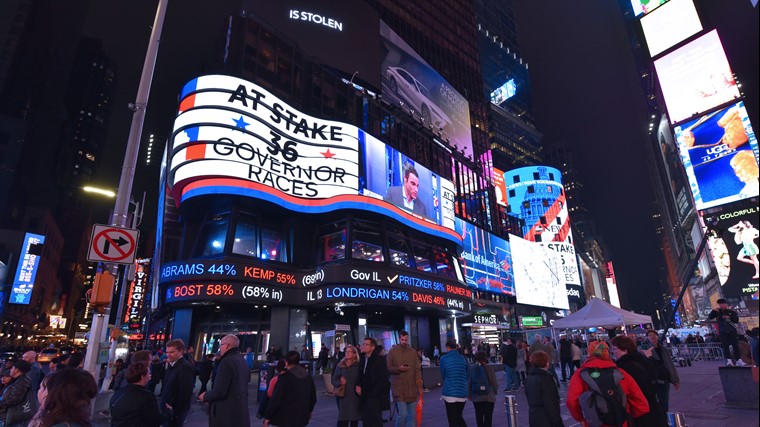
Times Square, New York, on election night. Most of the stats, graphics and visuals on the hundreds of screens are made in Bergen, Norway.
This year the U.S election outcome is more uncertain than ever, with chaos and cascading crisis of all kind leading up to election day. Adding to the story, the president is highly unlikely to admit defeat regardless of the actual result. As Americans anxiously await the result, and the rest of us are holding our breath, in the midst of this historic day of television on nearly every screen in the world will be Vizrt.
Follow live
If you, like us, are interested in following both the election and the storytelling, you can follow the Vizrt live 2020 Election Blog & social media coverage on Nov. 3rd and see elections powered Vizrt storytelling tools. From CNN in New York City, USA, to TNN in Bangkok, Thailand, the Vizrt team of election watchers will cover nearly 100 broadcasters as they present the very best, most innovative use of Vizrt’s software-defined and data-driven graphics.